


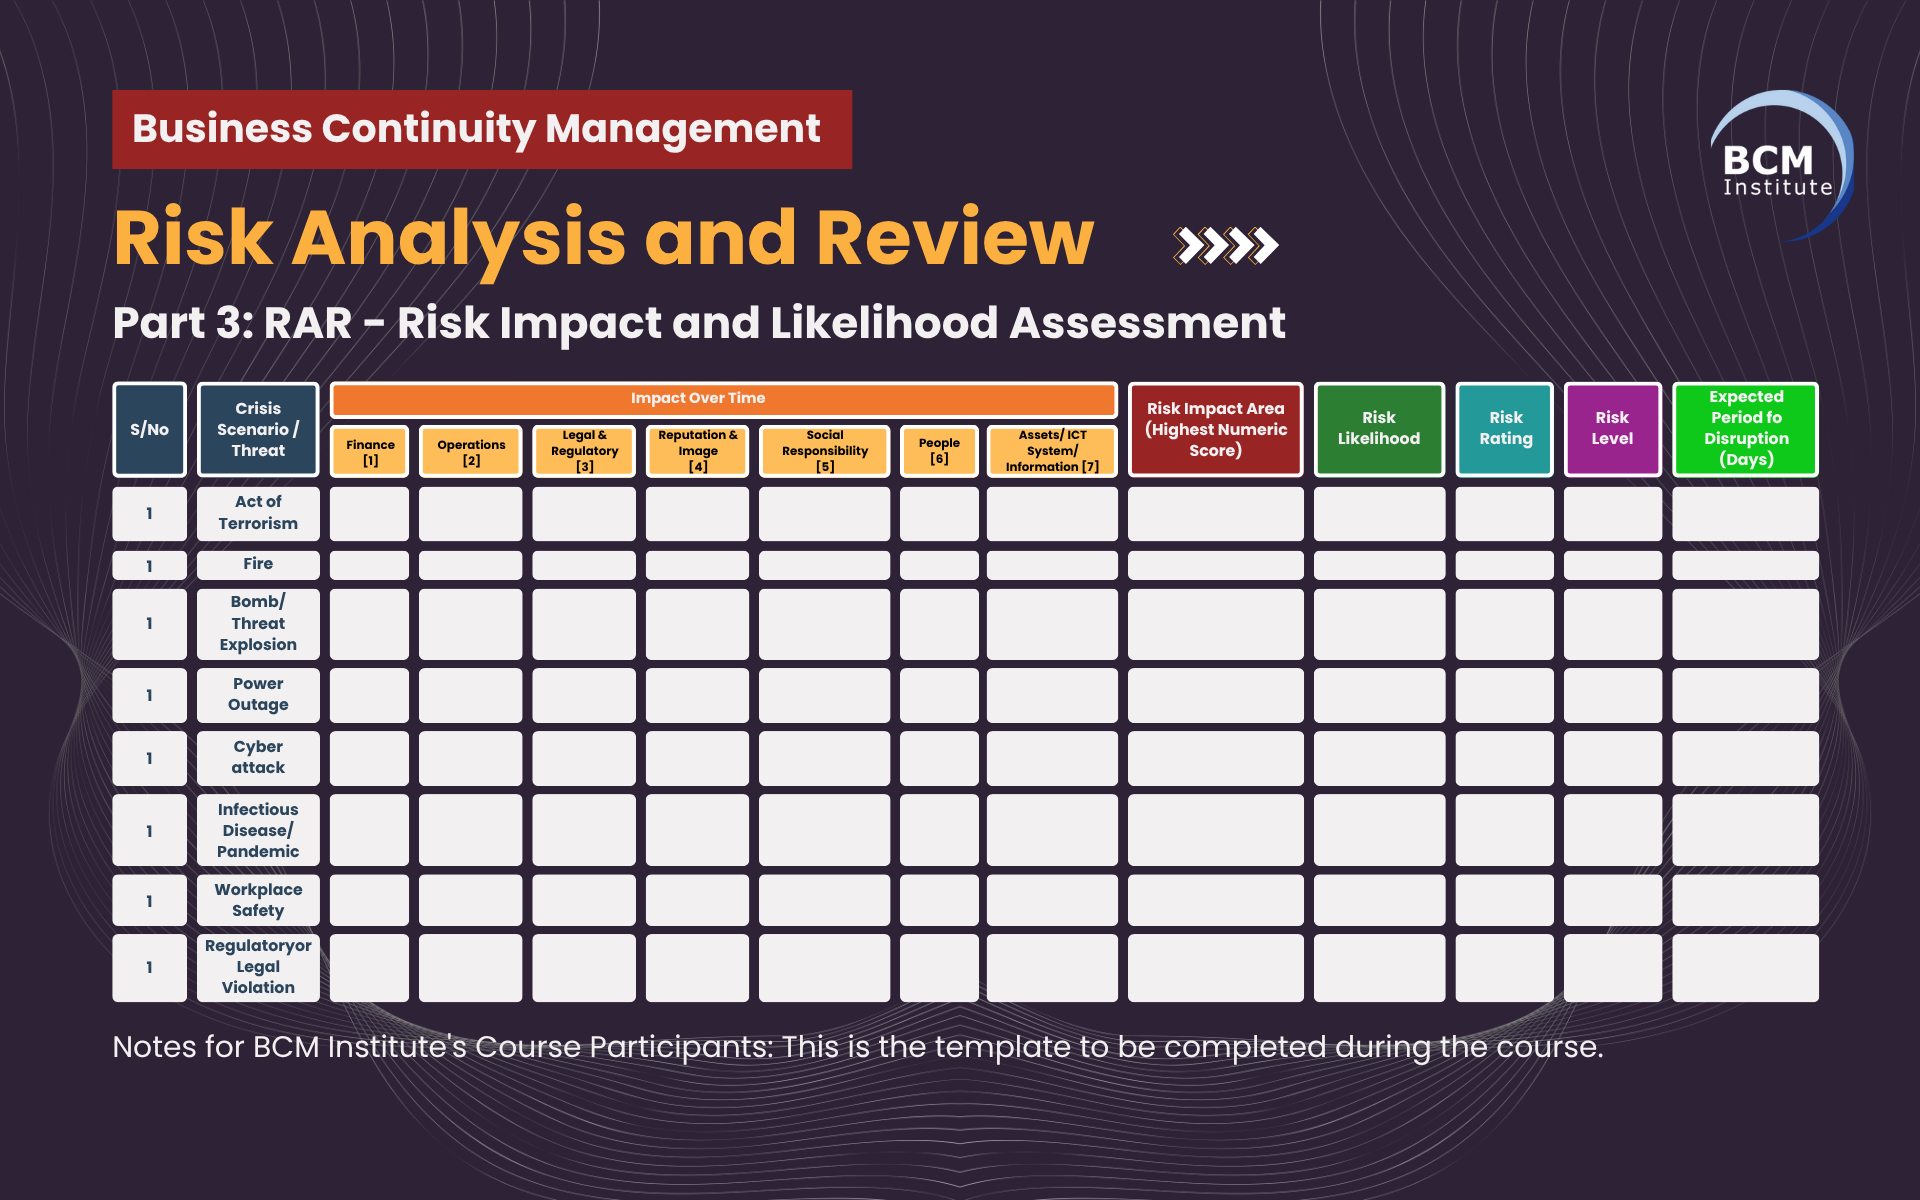
Part 3: RAR – Risk Impact and Likelihood Assessment
![[BCM] [TAL] [E3] [RAR] [T3] Risk Impact and Likelihood Assessment](https://no-cache.hubspot.com/cta/default/3893111/0b422c49-9f00-4c20-be6e-4be73551cb59.png)
In continuation of the Risk Analysis and Review (RAR) process, this chapter presents a structured evaluation of the impact and likelihood of the threats previously identified in Part 1: RAR – List of Threats.
This assessment is a critical component of the Business Continuity Management (BCM) methodology, providing Tripartite Alliance Limited (TAL) with a data-driven approach to prioritise risks and guide resource allocation.
Each threat is analysed across a comprehensive set of impact areas, including:
- Finance
- Operations
- Legal & Regulatory
- Reputation & Image
- Social Responsibility
- People
- Assets / IT Systems / Information
In addition to assigning numerical values to the highest impact across these categories, each threat is also rated by its likelihood of occurrence. These two factors are multiplied to derive a Risk Rating, which is then classified into one of four Risk Levels: Low, Medium, High, or Extreme.
The analysis also considers the expected period of disruption should the risk materialise.
By evaluating threats in this structured manner, TAL can better understand the potential severity of disruptions and focus its risk mitigation and preparedness efforts on those that pose the greatest threat to its mission and operations.
This is the "Part 3: RAR – Risk Impact and Likelihood Assessment" table for Tripartite Alliance Limited (TAL), derived from the threats listed in Part 1 and based on best practices from BCMPedia – Risk Analysis.
Assumptions
- Risk impact scores are rated on a scale of 1 (Low) to 5 (High).
- Likelihood is rated as Rare (1), Unlikely (2), Possible (3), Likely (4), Almost Certain (5).
- Risk Rating = Impact (highest score across categories) × Likelihood.
- Risk Level is derived from the Risk Rating:
- 1–4: Low
- 5–9: Medium
- 10–15: High
- 16–25: Extreme
Table: Risk Impact and Likelihood Assessment (Tripartite Alliance Limited)
|
Threat |
Finance |
Operations |
Legal & Regulatory |
Reputation & Image |
Social Responsibility |
People |
Assets/ IT / Info |
Highest Impact |
Likelihood |
Risk Rating |
Risk Level |
Expected Period of Disruption |
|
Flood |
2 |
4 |
1 |
2 |
2 |
3 |
2 |
4 |
3 (Possible) |
12 |
High |
0.5 to 1 day |
|
Haze / Air Pollution |
1 |
3 |
1 |
2 |
3 |
4 |
1 |
4 |
3 (Possible) |
12 |
High |
1 to 3 days |
|
Lightning & Thunderstorm |
1 |
2 |
1 |
1 |
1 |
2 |
3 |
3 |
4 (Likely) |
12 |
High |
< 1 day |
|
Civil Unrest / Riot |
3 |
4 |
3 |
4 |
3 |
4 |
3 |
4 |
2 (Unlikely) |
8 |
Medium |
1 to 2 days |
|
Terrorist Threat |
4 |
5 |
4 |
5 |
4 |
5 |
4 |
5 |
1 (Rare) |
5 |
Medium |
> 7 days |
|
Fire / Gas Leak Nearby |
2 |
4 |
2 |
3 |
2 |
3 |
3 |
4 |
2 (Unlikely) |
8 |
Medium |
1 to 3 days |
|
Pandemic / Disease Outbreak |
3 |
4 |
2 |
4 |
4 |
5 |
3 |
5 |
3 (Possible) |
15 |
High |
> 7 days |
|
Public Transport Disruption |
1 |
3 |
1 |
1 |
2 |
3 |
1 |
3 |
4 (Likely) |
12 |
High |
0.5 to 1 day |
|
Labour Shortage |
3 |
4 |
2 |
2 |
3 |
4 |
2 |
4 |
3 (Possible) |
12 |
High |
> 7 days |
|
IT Vendor Failure |
2 |
4 |
3 |
2 |
2 |
2 |
4 |
4 |
3 (Possible) |
12 |
High |
1 to 3 days |
|
Facilities Mgmt Breakdown |
2 |
3 |
1 |
1 |
2 |
2 |
2 |
3 |
3 (Possible) |
9 |
Medium |
< 1 day |
|
Training/Comms Vendor Delay |
2 |
3 |
2 |
3 |
3 |
2 |
2 |
3 |
3 (Possible) |
9 |
Medium |
1 to 2 days |
|
Power Failure |
2 |
4 |
2 |
2 |
2 |
2 |
4 |
4 |
3 (Possible) |
12 |
High |
< 1 day |
|
Network Failure |
2 |
4 |
2 |
2 |
2 |
2 |
4 |
4 |
4 (Likely) |
16 |
Extreme |
0.5 to 1 day |
|
Cyberattack / Ransomware |
4 |
4 |
5 |
5 |
3 |
4 |
5 |
5 |
3 (Possible) |
15 |
High |
1 to 3 days |
|
Hardware Failure |
2 |
3 |
1 |
1 |
1 |
2 |
3 |
3 |
3 (Possible) |
9 |
Medium |
< 1 day |
Here is a risk heat map representation for Tripartite Alliance Limited (TAL), based on the Part 3 risk assessment data and mapped onto a standard 5×5 grid using Likelihood (horizontal axis) and Highest Impact (vertical axis).
The coloured regions highlight Low (Green), Medium (Yellow), High (Orange), and Extreme (Red) risk levels.
Risk Heat Map (TAL)
Each risk is plotted according to its Likelihood (1–5) and Highest Impact score (1–5):
css
CopyEdit
Impact ↓\Likelihood → 1 2 3 4 5
5 [Terrorist] [Pandemic] [Network]
4 [Labour] [Flood] [Haze] [IT Vendor] [Power]
3 [Thunderstorm] [Facilities] [Training Delay] [Hardware]
2 –
1 –
Colour coding by Risk Level:
- Green (Low): Risk Rating ≤ 4
- Yellow (Medium): 5 ≤ Rating ≤ 9
- Orange (High): 10 ≤ Rating ≤ 15
- Red (Extreme): Rating ≥ 16
Detailed Plot & Risk Level Summary
|
Threat |
Likelihood |
Impact |
Rating |
Risk Level |
|
Network Failure |
4 |
4 |
16 |
Extreme 🔴 |
|
Pandemic / Disease |
3 |
5 |
15 |
High 🟠 |
|
Cyberattack / Ransomware |
3 |
5 |
15 |
High 🟠 |
|
Labour Shortage |
3 |
4 |
12 |
High 🟠 |
|
Flood |
3 |
4 |
12 |
High 🟠 |
|
Haze / Air Pollution |
3 |
4 |
12 |
High 🟠 |
|
IT Vendor Failure |
3 |
4 |
12 |
High 🟠 |
|
Power Failure |
3 |
4 |
12 |
High 🟠 |
|
Lightning & Thunderstorm |
4 |
3 |
12 |
High 🟠 |
|
Civil Unrest / Riot |
2 |
4 |
8 |
Medium 🟡 |
|
Fire / Gas Leak Nearby |
2 |
4 |
8 |
Medium 🟡 |
|
Facilities Mgmt Breakdown |
3 |
3 |
9 |
Medium 🟡 |
|
Training / Comms Delay |
3 |
3 |
9 |
Medium 🟡 |
|
Terrorist Threat |
1 |
5 |
5 |
Medium 🟡 |
|
Hardware Failure |
3 |
3 |
9 |
Medium 🟡 |
Interpretation & Use
- Network Failure occupies the top-right corner (Impact 4 × Likelihood 4 = 16)—categorised as Extreme risk and marked in red, signalling the highest priority for mitigation.
- The high‑risk cluster (orange) includes threats scoring between 12 and 15, many of which—like Cyberattacks, Pandemic, IT Vendor Failure, and Floods—affect critical operations and require robust controls.
- Medium‑risk (yellow) threats are those with moderate combinations of likelihood and impact, warranting monitoring and potentially incremental mitigations.
- No threats fall in the Low/Green zone, confirming that all identified risk scenarios pose at least moderate concern for TAL’s operations.
Next Steps
- Prioritise red and orange threats for immediate action—e.g., strengthen network resilience, cyber defence, and pandemic readiness.
- Review medium‑risk areas periodically, ensuring existing controls remain adequate and adjusting if likelihood or impact changes.
- Update the heat map quarterly or after significant changes—such as new services, building relocations, or regulatory shifts—to reflect evolving risk posture.
Summing Up ...
The risk impact and likelihood assessment conducted in this chapter provides a clear, quantifiable picture of the threat landscape faced by Tripartite Alliance Limited (TAL).
Through a systematic evaluation of each threat’s potential impact across key operational domains and its likelihood of occurrence, this analysis forms the foundation for informed decision-making and prioritisation of risk treatment efforts.
High and extreme risks—such as network failure, cyberattacks, and pandemic outbreaks—demand immediate and proactive mitigation, while medium-level threats require ongoing monitoring and periodic review.
The use of a heat map enables visual identification of risk concentration areas and facilitates leadership engagement in risk governance.
As TAL continues to deliver public value in promoting fair and progressive workplace practices in Singapore, this risk assessment ensures that the organisation remains resilient, responsive, and ready to manage disruptions with agility and confidence.
| Resilient Partnership: Implementing BCM at Tripartite Alliance | ||||||
| eBook 3: Starting Your BCM Implementation |
||||||
| MBCO | P&S | RAR T1 | RAR T2 | RAR T3 | BCS T1 | TOC |
![[BCM] [TAL] [E3] [BIA] MBCO Corporate MBCO](https://no-cache.hubspot.com/cta/default/3893111/9080a06b-c2f0-4a72-988a-4cd13ce54f47.png) |
![[BCM] [TAL] [BIA] [P&S] Key Product and Services](https://no-cache.hubspot.com/cta/default/3893111/307ac053-1aed-4e21-b430-f356dd86bc3c.png) |
![[BCM] [TAL] [E3] [RAR] [T1] List of Threats](https://no-cache.hubspot.com/cta/default/3893111/8c1a66cb-c0ae-4de9-9d03-8887d6d6788b.png) |
![[BCM] [TAL] [E3] [RAR] [T2] Treatment and Control](https://no-cache.hubspot.com/cta/default/3893111/3b9018e6-d96e-4bfa-84b6-deb76c12ec26.png) |
|
![[BCM] [TAL] [E3] [BCS] [T1] Mitigation Strategies and Justification](https://no-cache.hubspot.com/cta/default/3893111/1670f67f-f97f-42d9-bdc8-ce26cc17f035.png) |
![[BCM] [TAL] [E1] [C10] Identifying Critical Business Functions](https://no-cache.hubspot.com/cta/default/3893111/03d6ce68-f61f-4fdf-bbfe-0fb4921f10c7.png) |
| CBF 1: Dispute Management and Advisory Services (via TADM) | ||||||
| DP | BIAQ T1 | BIAQ T2 | BIAQ T3 | BCS T2 | BCS T3 | PD |
![[BCM] [TAL] [E3] [BIA] [DP] [CBF] [1] Dispute Management and Advisory Services (via TADM)](https://no-cache.hubspot.com/cta/default/3893111/fa99579d-3ea6-4ce4-bdc3-59990b67050a.png) |
![[BCM] [TAL] [E3] [BIA] [T1] [CBF] [1] Dispute Management and Advisory Services (via TADM)](https://no-cache.hubspot.com/cta/default/3893111/fcb583ea-4ac0-4cc6-b48e-9f487b31574e.png) |
![[BCM] [TAL] [E3] [BIA] [T2] [CBF] [1] Dispute Management and Advisory Services (via TADM)](https://no-cache.hubspot.com/cta/default/3893111/2cc73eb6-95eb-4a5f-91c2-48762fb97f32.png) |
![[BCM] [TAL] [E3] [BIA] [T3] [CBF] [1] Dispute Management and Advisory Services (via TADM)](https://no-cache.hubspot.com/cta/default/3893111/d4863fde-e9d8-4107-94e0-a46ac2d39a76.png) |
![[BCM] [TAL] [E3] [BCS] [T2] [CBF] [1] Recovery Strategies](https://no-cache.hubspot.com/cta/default/3893111/b4cbdf20-029f-4a56-bdf1-061ead0c0751.png) |
![[BCM] [TAL] [E3] [BCS] [T3] [CBF] [1] Minimum Resources Required during a Disaster](https://no-cache.hubspot.com/cta/default/3893111/056923e5-8bfb-47bb-a2e1-fc93b9241f88.png) |
![[BCM] [TAL] [E3] [PD] [CBF] [1] Dispute Management and Advisory Services (via TADM)](https://no-cache.hubspot.com/cta/default/3893111/81039579-840a-4cfb-8fe8-44d3ec828153.png) |
| CBF 2: Promotion of Fair and Progressive Employment Practices (via TAFEP) |
||||||
| DP | BIAQ T1 | BIAQ T2 | BIAQ T3 | BCS T2 | BCS T3 | PD |
![[BCM] [TAL] [E3] [BIA] [DP] [CBF] [2] Promotion of Fair and Progressive Employment Practices](https://no-cache.hubspot.com/cta/default/3893111/fecb7d9c-5d8b-4ce1-8c26-4c18272a2d55.png) |
![[BCM] [TAL] [E3] [BIA] [T1] [CBF] [2] Promotion of Fair and Progressive Employment Practices](https://no-cache.hubspot.com/cta/default/3893111/2115dd63-7a25-49b0-8612-97838c40d394.png) |
![[BCM] [TAL] [E3] [BIA] [T2] [CBF] [2] Promotion of Fair and Progressive Employment Practices](https://no-cache.hubspot.com/cta/default/3893111/9d4d1699-d502-4b62-89b8-1a6a2a1b9a60.png) |
![[BCM] [TAL] [E3] [BIA] [T3] [CBF] [2] Promotion of Fair and Progressive Employment Practices](https://no-cache.hubspot.com/cta/default/3893111/d5eb085e-c228-49a9-bec1-4dee2c0a7da1.png) |
![[BCM] [TAL] [E3] [BCS] [T2] [CBF] [2] Recovery Strategies](https://no-cache.hubspot.com/cta/default/3893111/9818dfff-5279-4926-858e-5f3a03745262.png) |
![[BCM] [TAL] [E3] [BCS] [T3] [CBF] [2] Minimum Resources Required during a Disaster](https://no-cache.hubspot.com/cta/default/3893111/18987dd2-6328-48e7-8270-42005443df1a.png) |
![[BCM] [TAL] [E3] [PD] [CBF] [2] Promotion of Fair and Progressive Employment Practices](https://no-cache.hubspot.com/cta/default/3893111/203d2fcd-06c8-423f-93c6-0286b14b42fe.png) |
More Information About Business Continuity Management Courses
To learn more about the course and schedule, click the buttons below for the BCM-300 Business Continuity Management Implementer [BCM-3] and the BCM-5000 Business Continuity Management Expert Implementer [BCM-5].


![Register [BL-B-3]*](https://no-cache.hubspot.com/cta/default/3893111/ac6cf073-4cdd-4541-91ed-889f731d5076.png)


![FAQ [BL-B-3]](https://no-cache.hubspot.com/cta/default/3893111/b3824ba1-7aa1-4eb6-bef8-94f57121c5ae.png)
![Email to Sales Team [BCM Institute]](https://no-cache.hubspot.com/cta/default/3893111/3c53daeb-2836-4843-b0e0-645baee2ab9e.png)


