


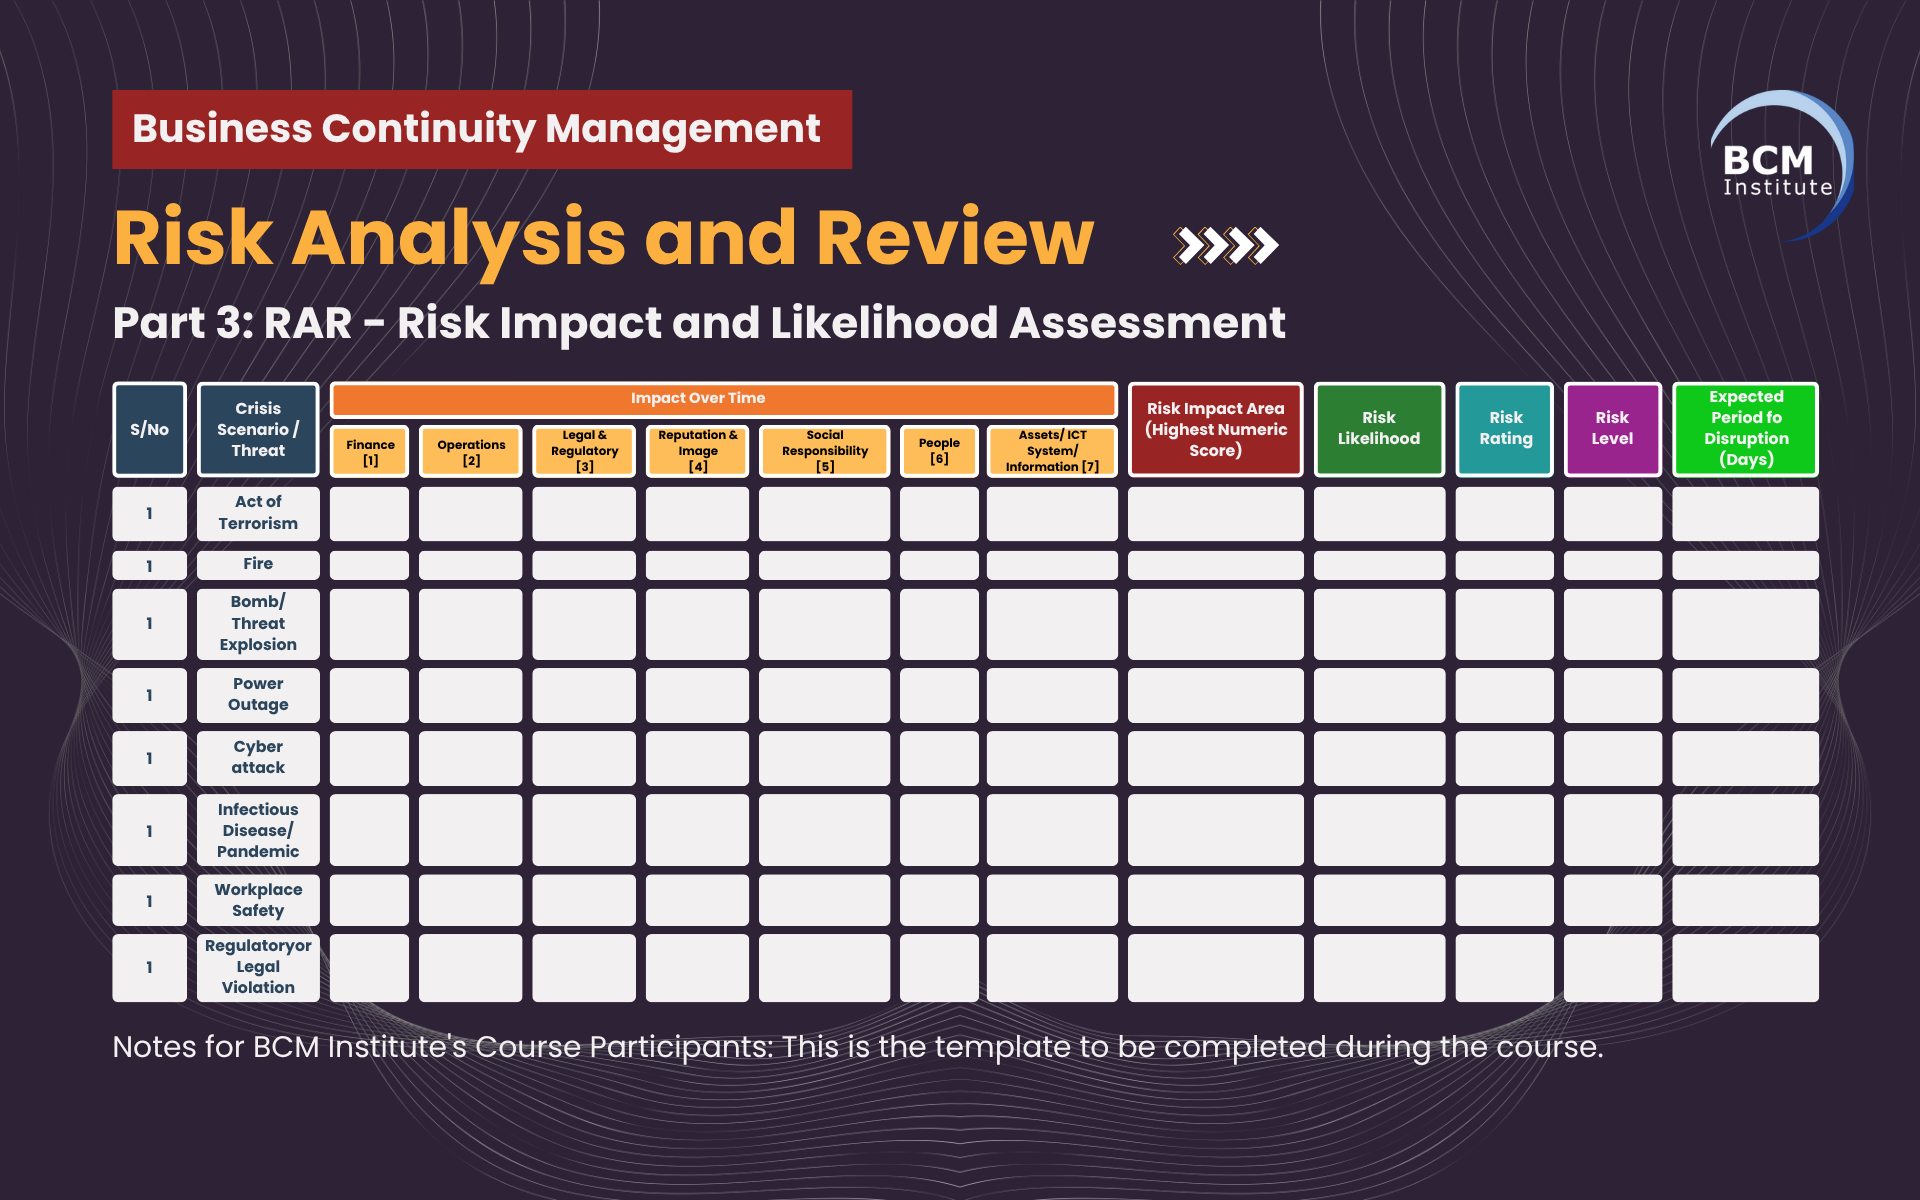
Part 3: RAR – Risk Impact and Likelihood Assessment
In the realm of crisis management and business continuity, effective risk assessment is the cornerstone of strategic preparedness.
This chapter—Part 3: RAR – Risk Impact and Likelihood Assessment—guides practitioners through the systematic evaluation of risks by examining both their potential impact and the likelihood of occurrence.
By quantifying and prioritising risks, organisations gain the clarity needed to allocate resources wisely, strengthen their risk posture, and enhance resilience.
This section introduces key assessment criteria, risk rating matrices, and practical approaches to calibrate and contextualise threats in alignment with organisational objectives and risk appetite.
This is the structured Risk Impact & Likelihood Assessment table for Credit Guarantee Corporation Malaysia, based on threats selected from Part 1: RAR – List of Threats.
|
Threat |
Finance |
Operations |
Legal & Regulatory |
Reputation & Image |
Social Responsibility |
People |
Assets/IT Systems/Information |
Risk Impact Area (Max Score) |
Risk Likelihood |
Risk Rating |
Risk Level |
Expected Period of Disruption |
|
Flood |
3 |
4 |
2 |
3 |
2 |
3 |
4 |
Operations (4) |
Medium |
16 |
Moderate |
1–3 days |
|
Power Outage |
2 |
4 |
1 |
2 |
1 |
2 |
4 |
IT (4) |
Medium |
14 |
Moderate |
Hours–1 day |
|
IT Failure (hardware/software) |
3 |
4 |
2 |
3 |
1 |
2 |
5 |
IT (5) |
High |
20 |
High |
1–2 days |
|
Infectious Disease / Pandemic |
4 |
4 |
3 |
3 |
2 |
5 |
1 |
People (5) |
High |
24 |
High |
1–4 weeks |
|
Loss of Key Appointment Holders |
3 |
3 |
2 |
2 |
2 |
4 |
1 |
People (4) |
Medium |
16 |
Moderate |
1–2 weeks |
|
Regulatory or Legal Violation (third-party) |
4 |
3 |
5 |
4 |
3 |
2 |
1 |
Legal & Regulatory (5) |
Medium |
18 |
High |
2–4 weeks |
|
IT Sabotage (cyber‑attack) |
5 |
4 |
4 |
5 |
2 |
3 |
5 |
IT & Finance (5) |
High |
25 |
Extreme |
3–7 days |
|
Network Failure |
2 |
4 |
1 |
2 |
1 |
2 |
4 |
IT (4) |
Medium |
14 |
Moderate |
Hours–1 day |
Notes on Table Structure
- Impact Scores range from 1 (Low) to 5 (Very High), per impact area.
- Risk Impact Area identifies the category with the highest numeric score.
- Risk Likelihood levels—Low, Medium, High—reflect probability based on historical data and expert judgment.
- Risk Rating is calculated as the sum of all Impact Area scores multiplied by a Likelihood factor (e.g., 1=Low, 2=Medium, 3=High).
- Risk Level is determined using thresholds (e.g., 1–9 = Low, 10–17 = Moderate, 18–24 = High, 25+ = Extreme).
- Expected Period of Disruption indicates a realistic timeframe for business interruption.
What You Can Do Next
- Review & Adjust: Align impact and likelihood scores with CGC Malaysia’s experience, internal data, and expert assessment.
- Customise: Add or remove threats based on local/regional context.
- Validate Thresholds: Ensure Risk Rating thresholds fit your organisation’s risk appetite and governance framework.
- Link Back: Use the detailed guidance at BCMpedia for definitions, scoring advice, and scenario considerations
Summing Up ...
A well-executed Risk Impact and Likelihood Assessment enables organisations to transition from reactive to proactive risk management.
Through structured analysis and scoring, decision-makers can identify which threats demand immediate attention and which require ongoing monitoring.
As demonstrated in this chapter, the RAR process not only informs risk prioritisation but also lays the groundwork for developing effective mitigation strategies and continuity plans.
With a clear understanding of both impact and likelihood, organisations are better equipped to navigate uncertainties and sustain operations in the face of potential disruptions.


More Information About Business Continuity Management Courses
To learn more about the course and schedule, click the buttons below for the BCM-300 Business Continuity Management Implementer [BCM-3] and the BCM-5000 Business Continuity Management Expert Implementer [BCM-5].


![Register [BL-B-3]*](https://no-cache.hubspot.com/cta/default/3893111/ac6cf073-4cdd-4541-91ed-889f731d5076.png)


![FAQ [BL-B-3]](https://no-cache.hubspot.com/cta/default/3893111/b3824ba1-7aa1-4eb6-bef8-94f57121c5ae.png)
![Email to Sales Team [BCM Institute]](https://no-cache.hubspot.com/cta/default/3893111/3c53daeb-2836-4843-b0e0-645baee2ab9e.png)


